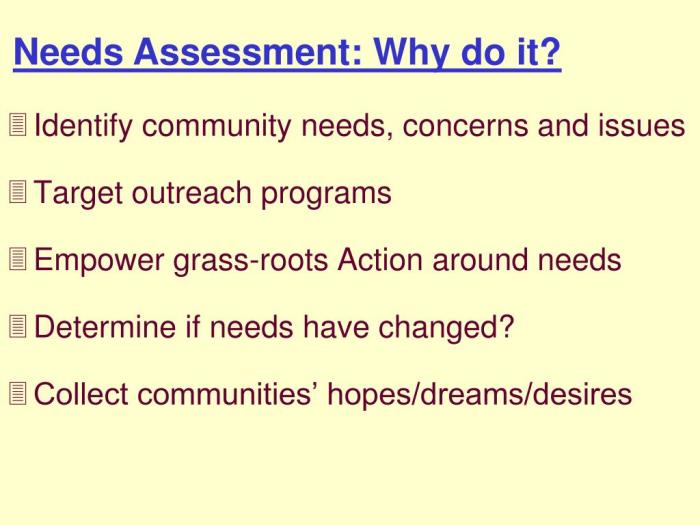
Community Needs Assessment Understanding Your Community
Community Needs Assessment: It’s more than just a fancy phrase; it’s the roadmap to building a better future for your community. Think of it as a deep dive into understanding the hopes, dreams, and challenges of the people around you. By identifying key needs and prioritizing them, we can create targeted solutions that make a real difference.
This process involves a careful blend of data collection, analysis, and stakeholder engagement. We’ll explore different methods for gathering information—from surveys and interviews to focus groups and observations—and learn how to analyze this data to uncover crucial trends and themes. The goal? To craft actionable recommendations that lead to impactful change.
Defining Community Needs
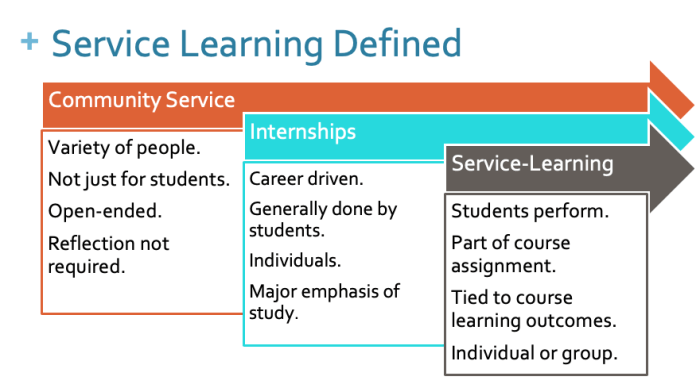
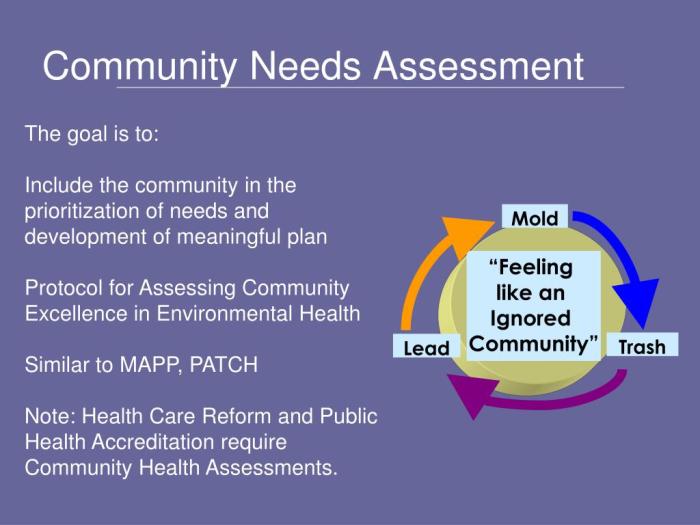
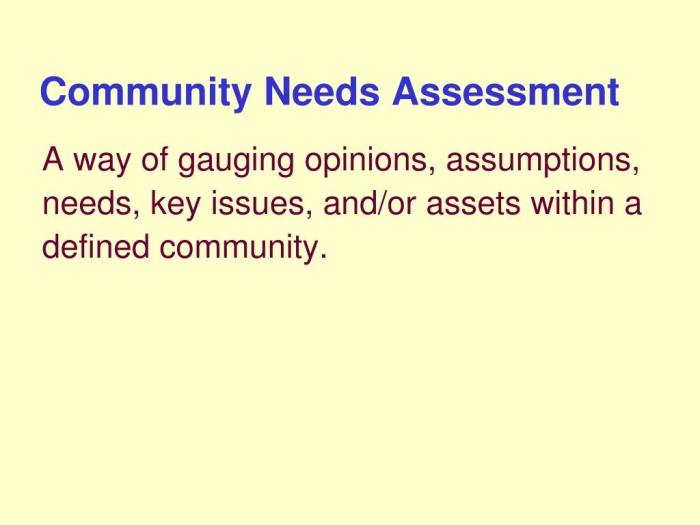
A community needs assessment is a systematic process used to identify the health and social needs of a specific population. It involves collecting and analyzing data to understand the existing resources, gaps in services, and unmet needs within that community. The goal is to inform decision-making and resource allocation to improve the overall well-being of the community members. This process is crucial for effective planning and implementation of community-based programs and initiatives.
Defining the target community is paramount for a successful assessment. A clearly defined community ensures that data collection and analysis are focused and relevant, preventing wasted resources and inaccurate conclusions. The definition should specify geographical boundaries, demographic characteristics (age, gender, ethnicity, socioeconomic status), and any other relevant factors that define the group under study. For example, a community could be defined as all residents within a specific zip code, or it could be a more narrowly defined group, such as all low-income families with children under five living in a particular neighborhood.
Types of Communities Requiring Assessment
Various types of communities may require a needs assessment. These can range from geographically defined areas to communities based on shared characteristics or interests. Examples include geographical communities (e.g., a town, a neighborhood, a rural county), communities of interest (e.g., people with a specific health condition like diabetes, a particular ethnic group, veterans), and communities defined by organizational affiliation (e.g., a school district, a hospital’s patient population, members of a faith-based organization). Each requires a tailored approach to data collection and analysis, focusing on the specific needs and characteristics of that group.
Framework for Identifying the Scope of a Community Needs Assessment
A well-defined scope is crucial for a successful community needs assessment. The scope Artikels the specific goals, objectives, and parameters of the assessment. It should clearly define:
- The target population: A precise description of the community to be assessed, including geographical boundaries, demographics, and other relevant characteristics.
- The needs to be assessed: A list of specific health, social, or economic needs that will be the focus of the assessment. This might include access to healthcare, housing, education, employment, or food security. Prioritizing needs based on their severity and prevalence is vital.
- Data collection methods: The methods used to gather information, such as surveys, interviews, focus groups, existing data analysis (e.g., census data, hospital records), and observations. The chosen methods should be appropriate for the target population and the types of needs being assessed.
- Timeline and budget: A realistic timeline for completing the assessment and a detailed budget outlining all anticipated costs.
- Dissemination plan: A strategy for sharing the assessment findings with stakeholders and the community, including reports, presentations, and community forums.
A well-structured framework ensures the assessment remains focused, efficient, and ultimately effective in identifying and addressing community needs. Failing to clearly define the scope can lead to an unfocused assessment, producing results that are difficult to interpret or use for effective planning. For instance, an assessment focused on housing needs in a city without specifying the target population (e.g., low-income families, elderly residents) would lack the specificity needed to effectively address the problem.
Data Collection Methods
Source: slideserve.com
Gathering accurate and reliable data is crucial for a successful community needs assessment. The methods you choose will significantly impact the quality of your findings and the effectiveness of your subsequent interventions. Choosing the right mix of methods often provides a more comprehensive understanding of the community’s needs.
Several methods exist for collecting data, each with its strengths and weaknesses. Understanding these nuances is key to designing a robust and ethical data collection strategy. The most common methods include surveys, interviews, focus groups, and observations.
Survey Methods
Surveys are a cost-effective way to gather data from a large number of people quickly. They can be administered in various formats, including online, paper-based, or via telephone. Structured surveys, with pre-determined questions and response options, are easy to analyze quantitatively. However, they may limit the richness of the responses. Open-ended questions in surveys allow for more qualitative data but can be more challenging to analyze. For example, a survey distributed to households in a neighborhood could assess residents’ satisfaction with local parks and recreational facilities.
Interview Methods
Interviews allow for more in-depth exploration of individual perspectives. Structured interviews use a pre-determined set of questions, ensuring consistency, while semi-structured interviews allow for more flexibility and follow-up questions. Unstructured interviews are more conversational, allowing for deeper exploration of particular topics. For example, conducting one-on-one interviews with key community leaders can provide valuable insights into their priorities and perspectives on community needs.
Focus Group Methods
Focus groups bring together a small group of people to discuss a specific topic. They offer a rich source of qualitative data, allowing for the exploration of shared perspectives and differing opinions within the community. For instance, a focus group with local youth could reveal their perspectives on access to education and recreational opportunities. However, the group dynamic can influence responses, and the findings might not be representative of the entire community.
Observation Methods
Observations involve systematically watching and recording behaviors and interactions within a community. This can be participant observation, where the researcher becomes part of the community, or non-participant observation, where the researcher remains an outsider. Observations provide valuable contextual information that may not be revealed through other methods. For example, observing traffic patterns in a specific area could highlight the need for improved pedestrian safety measures.
Comparison of Data Collection Methods
The following table summarizes the advantages and disadvantages of each method:
| Method | Advantages | Disadvantages | Ethical Considerations |
|---|---|---|---|
| Surveys | Cost-effective, large sample size, quick data collection | Limited depth of information, the potential for response bias | Ensure anonymity and confidentiality; obtain informed consent. |
| Interviews | In-depth information, flexibility, opportunity for clarification | Time-consuming, expensive, smaller sample size | Maintain confidentiality; obtain informed consent; ensure interviewer neutrality. |
| Focus Groups | Rich qualitative data, exploration of shared perspectives | Potential for groupthink, difficult to generalize findings | Ensure participant comfort and safety; obtain informed consent; ensure group dynamics do not skew results. |
| Observations | Provides contextual information, reveals unspoken needs | Time-consuming, observer bias, ethical concerns about privacy | Respect participants’ privacy; obtain informed consent (if applicable); ensure observational methods are not intrusive. |
Ethical Considerations in Data Collection
Ethical considerations are paramount in community needs assessments. Researchers must prioritize the protection of participants’ rights and welfare. This includes obtaining informed consent, ensuring anonymity and confidentiality, minimizing risks, and respecting participants’ autonomy. Researchers should also be aware of potential biases and take steps to mitigate them. For example, ensuring a diverse research team can help minimize researcher bias. Transparency in the research process is also essential, ensuring participants understand how the data will be used and protected.
Analyzing Collected Data
Source: slideserve.com
After you’ve gathered your data – whether through surveys, interviews, focus groups, or observations – the next crucial step is analyzing it. This involves transforming raw data into meaningful insights that reveal the community’s needs. This process helps you understand patterns, identify priorities, and ultimately, inform your action plan.
Data analysis differs depending on whether your data is qualitative (descriptive, like interview transcripts) or quantitative (numerical, like survey results). Both types are valuable and often used together to provide a complete picture.
Qualitative Data Analysis Methods
Qualitative data analysis focuses on understanding the meaning and context behind the information collected. Thematic analysis is a common approach. It involves systematically identifying, analyzing, and reporting patterns (themes) within qualitative data. This process helps to summarize large amounts of textual data and identify recurring ideas or concepts.
For example, imagine you conducted interviews about access to healthcare. Thematic analysis might reveal recurring themes such as transportation barriers, affordability concerns, and lack of culturally competent services. These themes then become the focus of your report and inform recommendations for improvement.
Quantitative Data Analysis Techniques
Quantitative data analysis uses statistical methods to identify patterns and relationships in numerical data. Common techniques include descriptive statistics (like calculating averages and percentages), inferential statistics (like hypothesis testing to determine if differences between groups are statistically significant), and correlation analysis (to see if two variables are related).
For instance, if you surveyed residents about their satisfaction with local parks, you could use descriptive statistics to calculate the average satisfaction rating. Inferential statistics could compare satisfaction levels between different age groups or income brackets. Correlation analysis could explore the relationship between park usage and resident satisfaction.
Step-by-Step Guide for Data Interpretation and Report Writing
- Data Cleaning and Preparation: Check for inconsistencies, missing data, and errors. Clean and organize your data to ensure accuracy.
- Data Summarization: Create tables, graphs, and charts to visually represent your findings. This makes complex data easier to understand.
- Theme Identification: Identify recurring themes and patterns in both your qualitative and quantitative data. Look for connections between different data sources.
- Interpretation: Analyze the identified themes and patterns. What do they tell you about the community’s needs? What are the implications of your findings?
- Report Writing: Structure your report clearly, including an introduction, methods, findings, discussion, and recommendations. Use visuals to enhance understanding.
Identifying Key Themes and Trends
This involves a careful examination of your analyzed data to identify the most prominent and recurring themes. For example, if your qualitative data reveals repeated concerns about affordable housing and your quantitative data shows a high percentage of residents struggling to pay rent, you have identified a key theme: affordable housing is a significant community need. Similarly, analyzing trends might show an increase in demand for certain services over time. This helps to prioritize needs based on their urgency and impact.
Identifying Key Needs and Priorities: Community Needs Assessment
Source: slideserve.com
After collecting and analyzing your data, the next crucial step is to identify the key needs within your community and prioritize them effectively. This involves carefully considering the urgency and impact of each need to ensure resources are allocated where they’ll make the biggest difference.
This process helps to focus efforts and resources on the most pressing issues, leading to more efficient and impactful community development initiatives. Prioritizing needs allows for a strategic approach, maximizing the positive outcomes of your efforts.
Criteria for Prioritizing Community Needs
Prioritizing community needs requires a systematic approach. We need to establish clear criteria to evaluate each need objectively. These criteria can include factors such as the number of people affected, the severity of the problem, the potential for positive change, and the availability of resources. For example, a need affecting a large percentage of the population with severe consequences will naturally rank higher than a need affecting a smaller group with less severe consequences, even if both are important. Consider using a weighted scoring system, assigning points to each criterion to create a quantitative measure for comparison.
Determining Urgency and Impact
Urgency refers to how quickly a need must be addressed to prevent further negative consequences. Impact measures the extent of the positive change that can be achieved by addressing the need. For example, a lack of clean drinking water is highly urgent and has a significant impact on public health. Conversely, while improving community aesthetics is important, it might have a lower urgency and impact compared to addressing food insecurity or lack of healthcare access. Analyzing the data collected should provide insights into both the urgency and impact of identified needs. Consider using a matrix that plots needs based on urgency and impact to visually represent their relative priority.
Prioritized List of Community Needs
To create a prioritized list, we must synthesize the information gathered from the data analysis and the urgency/impact assessment. This might involve ranking needs from most to least important, or grouping needs into categories based on their priority level. The list should clearly state each need, its associated urgency and impact, and the rationale for its placement within the priority ranking. For example:
| Need | Urgency | Impact | Priority |
|---|---|---|---|
| Access to affordable healthcare | High | High | 1 |
| Improved public transportation | Medium | Medium | 3 |
| Job training and placement programs | Medium | High | 2 |
| Community park renovation | Low | Medium | 4 |
This table provides a clear, concise overview of the prioritized needs. The rationale for each priority should be documented separately.
Presenting Findings Clearly and Concisely
Effective communication of your findings is critical. Use clear and concise language, avoiding jargon. Visual aids, such as charts, graphs, and maps, can significantly improve understanding. A summary report should highlight the key findings, including the prioritized list of needs and the rationale behind the prioritization. Consider presenting your findings to the community to ensure transparency and encourage participation in the implementation of solutions. A well-designed presentation, whether written or verbal, will ensure your findings are understood and used effectively to guide community development efforts.
Developing Actionable Recommendations
Now that you’ve identified the key needs and priorities of your community, it’s time to translate those findings into concrete steps. This involves creating actionable recommendations – a roadmap to positive change. This section focuses on transforming your assessment data into practical strategies for improvement.
This phase requires careful consideration of various factors to ensure the recommendations are realistic and effective. We’ll focus on creating SMART recommendations, outlining resource needs, and designing a monitoring and evaluation plan. Finally, we’ll look at examples of successful community projects to inspire your initiatives.
SMART Recommendations, Community Needs assessment
Creating SMART recommendations is crucial for effective implementation. SMART stands for Specific, Measurable, Achievable, Relevant, and Time-bound. Each recommendation should clearly define what will be done, how success will be measured, the resources required, its connection to the identified needs, and a realistic timeframe for completion. Vague goals lead to ineffective action.
- Specific: Instead of “Improve community health,” aim for “Increase participation in free health screenings by 25% by December 2024.”
- Measurable: Use quantifiable metrics. Instead of “Increase youth engagement,” aim for “Increase youth participation in after-school programs by 10% within six months, as measured by program attendance records.”
- Achievable: Ensure recommendations are realistic given available resources and community capacity. Don’t set unrealistic targets.
- Relevant: Recommendations should directly address the prioritized needs identified in the assessment. Every action should contribute to the overall goals.
- Time-bound: Set deadlines for each recommendation to maintain momentum and accountability. Without deadlines, progress can stall.
Resource Requirements
Once you have your SMART recommendations, carefully detail the resources needed for implementation. This includes human resources (staff, volunteers), financial resources (funding, grants), material resources (equipment, supplies), and technological resources (software, internet access). Be as specific as possible. For example, instead of stating “funding needed,” specify the amount required and potential funding sources.
Monitoring and Evaluation Plan
A robust monitoring and evaluation plan is essential to track progress, measure impact, and make adjustments as needed. This plan should Artikel how you will collect data to assess the effectiveness of your recommendations. Key performance indicators (KPIs) should be established to track progress toward your goals. Regular progress reports and evaluations will help determine whether adjustments to the strategies are necessary. This iterative process allows for course correction and maximizes the effectiveness of your efforts.
Examples of Successful Community Development Projects
Learning from past successes can provide valuable insights. Consider projects like the “East Harlem Block by Block” initiative, which utilized community-based participatory research methods to address local needs. Another example could be the “Detroit’s Green Dot” program, which implemented a violence prevention strategy that involved community members in identifying and addressing the root causes of violence. Studying these case studies reveals effective strategies, potential challenges, and best practices that can inform your initiatives. Detailed documentation of these projects, including their successes and failures, offers valuable lessons for your community development efforts.
Visual Representation of Findings

Source: carnahangroup.com
Presenting complex data from a community needs assessment in a clear and engaging way is crucial for effective communication. Visual representations are essential for transforming raw data into easily digestible information that stakeholders can understand and act upon. This section details how to effectively use visuals to communicate your findings.
Choosing the right visual aids depends heavily on the type of data you’ve collected and the key messages you want to convey. Different visuals are better suited for different types of information. For example, bar charts excel at comparing categories, while line graphs are ideal for showing trends over time. Pie charts effectively represent the proportions of a whole, and maps can be used to show the geographic distribution of needs.
Types of Visual Representations and Their Applications
Several visual tools can effectively communicate the results of your community needs assessment. The selection depends on the nature of the data and the message you aim to convey. Below are some examples and their appropriate uses.
- Bar Charts: Ideal for comparing different categories of needs (e.g., access to healthcare, housing, education). A bar chart would clearly show which need is most prevalent and by how much. For example, a vertical bar chart could compare the percentage of respondents reporting difficulty accessing healthcare, affordable housing, and quality education. Taller bars would represent higher percentages of reported difficulty.
- Line Graphs: Useful for displaying trends over time (e.g., changes in unemployment rates, crime statistics, or access to resources). A line graph could track the number of individuals accessing a specific community service over months or years, revealing trends in service utilization.
- Pie Charts: Best suited for showing the proportion of a whole (e.g., the percentage of the community facing different types of needs). A pie chart could visually represent the breakdown of needs into categories such as housing, healthcare, and employment, clearly showing the relative size of each need compared to the others.
- Maps: Effective for illustrating the geographic distribution of needs (e.g., areas with high rates of poverty, lack of access to transportation, or food insecurity). A map could use color coding to show areas with the highest concentration of reported needs, providing a visual representation of geographic disparities. Darker shades could represent higher concentrations of a particular need.
Narrative Accompanying Visual Representations
Visuals are powerful, but they need context. A compelling narrative is essential to interpret the data correctly. The narrative should not simply restate what the visual shows; it should provide insights, analysis, and recommendations based on the data.
For example, if a bar chart shows a high percentage of respondents reporting difficulty accessing affordable healthcare, the narrative might explain the potential consequences of this lack of access, such as poorer health outcomes and increased strain on the existing healthcare system. It could then connect this to specific recommendations, such as advocating for increased funding for community health clinics or expanding telehealth services.
Effective Communication Through Visual Aids
Effective communication hinges on simplicity and clarity. Avoid cluttering visuals with excessive data or complex labels. Use clear, concise titles and legends. Choose an appropriate scale for your graphs and charts to accurately reflect the data without distortion. Consider using consistent colors and fonts to maintain visual coherence. A well-designed visual should tell a story at a glance.
Importance of Visual Communication in Presenting Assessment Results
Visual communication is paramount in presenting assessment results because it enhances comprehension and engagement. Stakeholders, who may not be familiar with statistical analysis, can easily grasp the key findings through visually appealing and easily understandable charts and graphs. This facilitates a shared understanding of the community’s needs and fosters collaboration in developing effective solutions. Moreover, strong visuals leave a lasting impression, making your assessment more memorable and impactful.
Stakeholder Engagement
Source: healthworkforceta.org
Getting the right people involved is key to a successful community needs assessment. Without broad input, your findings might miss crucial details or fail to resonate with the community you’re trying to help. Effective stakeholder engagement ensures the assessment is relevant and accurate, and ultimately, leads to meaningful action.
Stakeholder involvement isn’t just a good idea; it’s essential for building trust, ensuring the assessment process is fair and equitable, and maximizing the impact of your recommendations. By actively involving stakeholders, you’re creating a shared understanding of community needs and fostering a sense of ownership in the solutions. This collaborative approach increases the likelihood that recommendations will be adopted and implemented effectively.
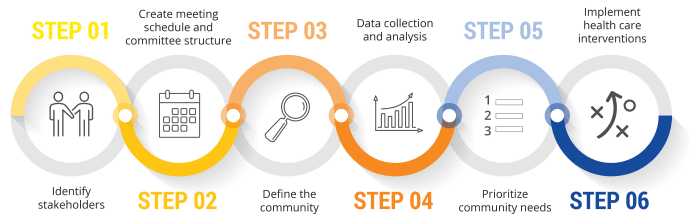
Identifying Key Stakeholders
Identifying the right stakeholders is crucial for a representative and effective needs assessment. These individuals or groups have a vested interest in the community and the outcome of the assessment. They can provide valuable insights, perspectives, and data that might otherwise be missed.
- Community members: Residents, business owners, and community leaders provide firsthand accounts of needs and challenges.
- Local government officials: Mayors, council members, and department heads offer insights into existing resources and policies.
- Non-profit organizations: These groups often have deep knowledge of community needs and existing service gaps.
- Healthcare providers: Physicians, nurses, and social workers can provide valuable data on health-related needs.
- Educational institutions: Schools, colleges, and universities can offer information on educational needs and opportunities.
- Businesses: Local businesses provide insights into economic conditions and employment opportunities.
Strategies for Effective Communication and Collaboration
Open and transparent communication is vital throughout the assessment process. Various strategies can enhance engagement and ensure everyone feels heard and valued.
- Regular meetings: Schedule regular meetings to keep stakeholders informed and allow for feedback.
- Surveys and questionnaires: Use these tools to gather broad input from a larger group of stakeholders.
- Focus groups: Facilitate discussions among smaller groups to delve deeper into specific issues.
- Interviews: Conduct one-on-one interviews with key stakeholders to obtain in-depth perspectives.
- Community forums: Host public forums to present findings and gather feedback from the wider community.
- Social media: Use social media platforms to disseminate information and engage stakeholders online.
Disseminating Assessment Findings
Sharing the assessment results effectively is critical for translating the findings into action. A well-planned dissemination strategy ensures stakeholders understand the key findings and can use them to inform decision-making.
- Reports: Prepare concise and user-friendly reports summarizing the key findings and recommendations.
- Presentations: Present the findings to stakeholders in an engaging and accessible format.
- Infographics: Use visuals to communicate complex data clearly and understandably.
- Community meetings: Hold meetings to discuss the findings and answer questions from stakeholders.
- Website and social media: Make the assessment report and key findings readily available online.
- Newsletters: Distribute newsletters summarizing the key findings and next steps.
Concluding Remarks
Source: slidesharecdn.com
Ultimately, a successful community needs assessment isn’t just about identifying problems; it’s about building solutions. By bringing together data, community input, and a collaborative spirit, we can create a dynamic plan for progress. The insights gained empower communities to take ownership of their future, driving sustainable and positive change for everyone involved. Remember, understanding your community is the first step towards transforming it.